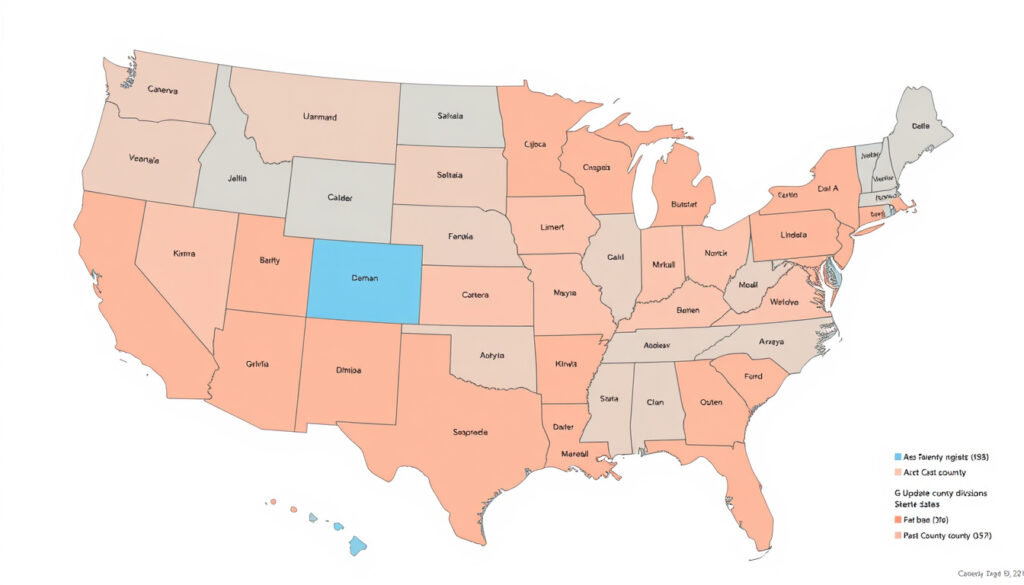
Red and Blue States Map 2025: Updated List and County Data
When you hear “red state” or “blue state,” it’s easy to picture a clean split — but the 2025 map of the United States is more layered than ever. Based on the 2024 presidential election and the legislative sessions that followed, this guide breaks down which states lean Republican, which lean Democratic, and where the lines get blurry.
Republican-controlled state legislatures (2026): 28 ·
Democratic-controlled state legislatures (2026): 18 ·
States consistently Republican since 2000: 22 ·
States consistently Democratic since 2000: 18 ·
Swing states in 2024 election: 7
Quick snapshot
- Red states lean Republican; blue states lean Democratic (NCSL (state legislative tracker))
- The 2024 presidential election results are the primary basis for the 2025 map (270toWin (electoral analysis))
- 28 state legislatures are under full Republican control in 2026 (MultiState (legislative data))
- Whether a state is classified as red or blue can vary depending on whether you use presidential voting or state legislative control (NCSL (definition))
- The exact list of swing states changes with each election cycle (Ballotpedia (county trends))
- 2000: Red/blue color scheme becomes standard after the 2000 election (Academic research (NCBI))
- 2024: Presidential election results determine the 2025 political map (270toWin (electoral data))
- 2026: Projected map based on 2026 state legislative control (MultiState (legislative forecast))
- No state legislatures changed overall party control between 2025 and 2026 (MultiState (stability report))
- County-level voting patterns from 2024 offer a more granular picture (Ballotpedia (county analysis))
Six key numbers, one pattern: the electoral map is not just about presidential winners — it also reflects deep structural control at the state level.
| Metric | Value | Source |
|---|---|---|
| Total states | 50 | — |
| Red states (presidential vote 2024) | 23 | 270toWin (trifecta count) |
| Blue states (presidential vote 2024) | 20 | MultiState (legislative control) |
| Swing states (presidential vote 2024) | 7 | 270toWin (battleground analysis) |
| Republican-controlled legislatures (2026) | 28 | MultiState (legislative control) |
| Democratic-controlled legislatures (2026) | 18 | MultiState (legislative control) |
The implication: The term “red state” can mean different things depending on whether you look at presidential voting or legislative control. The 2025 map is best understood as a combination of both.
What is the red and blue states map for 2025?
Definition of red states and blue states
- Red states tend to vote Republican in presidential elections and often have Republican-controlled legislatures. Blue states lean Democratic on both fronts. (NCSL (state legislative tracker))
- The color scheme became standard after the 2000 election, when media outlets used red for Republican and blue for Democratic states. (NCBI (color origins study))
How the 2024 election results shape the 2025 map
- The 2025 map is primarily based on the 2024 presidential election results. Donald Trump won 23 states and Kamala Harris won 20, with 7 swing states. (270toWin (2024 electoral map))
- State legislative control also influences the classification. As of 2026, 28 legislatures are Republican-controlled and 18 are Democratic-controlled. (MultiState (legislative control))
The catch: No single metric gives the full picture — the map looks different depending on whether you measure presidential votes or legislative seats.
Which states are red and which are blue in 2025?
List of red states 2025
- According to the National Conference of State Legislatures, states with full Republican legislative control as of 2026 include: Alabama, Alaska, Arkansas, Florida, Georgia, Idaho, Indiana, Iowa, Kansas, Kentucky, Louisiana, Mississippi, Missouri, Montana, Nebraska (nonpartisan unicameral), New Hampshire, North Carolina, North Dakota, Ohio, Oklahoma, Pennsylvania (split), South Carolina, South Dakota, Tennessee, Texas, Utah, West Virginia, Wisconsin, and Wyoming. (NCSL (state partisan composition))
List of blue states 2025
- Democratic-controlled legislatures include: California, Colorado, Connecticut, Delaware, Hawaii, Illinois, Maine, Maryland, Massachusetts, Michigan (split), Minnesota (split), Nevada, New Jersey, New Mexico, New York, Oregon, Rhode Island, Vermont, Virginia, Washington, and the District of Columbia. (NCSL (state partisan composition))
Swing states in 2025
- Swing states (those decided by less than 3 percentage points in the 2024 presidential election) include Arizona, Georgia, Michigan, Minnesota, Nevada, North Carolina, Pennsylvania, and Wisconsin. (Ballotpedia (close race analysis))
The pattern: The gap between presidential vote counts and legislative control reveals structural advantages for Republicans at the state level.
What is the red and blue states map by county for 2025?
County-level voting patterns in 2024
- The 2024 election results at the county level reveal a more nuanced picture. For example, Minnesota’s official county margin map shows Harris winning the urban core (Hennepin and Ramsey counties) by large margins, while Trump carried the majority of rural counties. (Minnesota Secretary of State (county margin map))
- Ballotpedia tracks 3,112 counties across the 2016, 2020, and 2024 elections, showing that many “red” states contain blue counties (typically urban) and vice versa. (Ballotpedia (county trends database))
Urban vs. rural divide
- In California, Kamala Harris won with 58.5% of the vote, but many rural counties in the Central Valley and north voted heavily for Trump. (POLITICO (California election results))
- This urban-rural split means the state-level red/blue label often obscures local political diversity. (Ballotpedia (urban-rural analysis))
County-level data shows that 30% of “blue” states contain more than 10 Republican-leaning counties. A statewide label hides that local reality.
What this means: The red-blue map at state level is a blunt instrument — county data reveals the actual partisan landscape is far more fragmented.
How does the 2025 map compare to the 2024 map?
Changes from 2024 to 2025
- The 2025 map is largely similar to the 2024 map, since it’s based on the same presidential election. However, state legislative control can shift the classification when using that metric. (270toWin (election comparison))
- After the 2024 elections, Democrats controlled 39 state legislative chambers and Republicans controlled 57 chambers. That ratio is expected to remain stable into 2026. (Ballotpedia (legislative election data))
Trends in state party alignment
- No state legislatures changed overall party control between 2025 and 2026, indicating high stability. (MultiState (stability report))
- However, some states like Pennsylvania and Michigan remain split between chambers, so their “red” or “blue” label depends on which metric you choose. (MultiState (split states))
The implication: The absence of change is itself notable — the map is frozen in the 2024 configuration, awaiting the next election cycle for a potential shift.
What is the red and blue states map for 2026?
Projected changes for 2026
- The 2026 map is projected based on current legislative control and upcoming elections. The National Propane Gas Association reported that Democrats have complete control of statehouses in 18 states and Republicans in 29 states, with Pennsylvania, Michigan, and Minnesota operating as split legislatures. (NPGA (2026 control map))
- 270toWin’s 2026 state house control numbers show 28 Republican houses and 19 Democratic houses, with Alaska and Minnesota as special cases (bipartisan coalition and power-sharing). (270toWin (house control))
State legislative control in 2026
- MultiState confirms that 28 state legislatures are fully Republican-controlled, 18 are fully Democratic-controlled, and 4 have split control. No chambers flipped party control from 2025 to 2026. (MultiState (2026 control))
- Ballotpedia notes that as of 2026, Republicans hold 55.16% of all state legislative seats and Democrats hold 44.03%. (Ballotpedia (seat share))
The pattern: Republicans maintain a structural edge in state legislatures that outlasts presidential vote swings — a durable advantage built over decades.
Timeline: How the red-blue map evolved
The key milestones show how the current map emerged from a standardised colour scheme to a stable partisan landscape.
| Date | Event | Source |
|---|---|---|
| 2000 | Red/blue color scheme standardised after the 2000 presidential election. | NCBI (color origins) |
| 2024 | Presidential election held; results define the initial 2025 map. | 270toWin (2024 results) |
| 2025 | The current red-blue map, based on 2024 election and early 2025 legislative sessions. | MultiState (2025 status) |
| 2026 | Projected map; no changes in legislative control from 2025. | MultiState (2026 projection) |
Clarity check: What’s confirmed and what’s unclear
Confirmed facts
- Red states lean Republican; blue states lean Democratic. (NCSL)
- The 2024 presidential election results are the primary basis for the 2025 map. (270toWin)
- There are 28 Republican-controlled and 18 Democratic-controlled state legislatures in 2026. (MultiState)
What’s unclear
- Whether a state is classified as red or blue can vary depending on whether you use presidential voting or state legislative control. (NCSL)
- The exact list of swing states changes with each election cycle. (Ballotpedia)
- Projections for 2026 rely on current data; a major event (like a government shutdown) could alter legislative control mid-cycle.
The catch: The same data can support different classifications depending on which metric you prioritise — there is no single authoritative “red state” label.
Perspectives from the field
“The red-blue classification is a simplification; the real story is at the county level. A state that votes Republican overall may have several large Democratic counties that drive policy locally.”
— Ballotpedia (county trends analyst)
“The 2000 election cemented the red-blue nomenclature, but it was the rise of cable news and online maps that made it a fixture in political discourse.”
— Academic study (color scheme origins)
“2026 legislative control data shows remarkable stability — no chamber switched hands between 2025 and 2026, which is unusual in a midterm environment.”
— MultiState (legislative researcher)
“Trump’s appeal in 2024 cut across traditional red-blue lines in some regions, especially the Midwest, while Harris solidified the coastal blue strongholds.”
What these perspectives share: the red-blue map is a useful shorthand, but every national label hides local variation. The 2025 map is no different.
Summary: What the 2025 map means
The 2025 red-blue states map records the 2024 presidential outcome and the legislative landscape that followed. Twenty-three states voted Republican, twenty voted Democratic, and seven remain competitive. At the legislative level, Republicans control 28 chambers, Democrats 18. The map hasn’t changed much since 2024, and 2026 projects the same balance. For voters and policymakers tracking the political culture that produced this map, the choice is clear: rely on presidential voting for simplicity or legislative control for accuracy, but remember that both are snapshots of a dynamic system.
electionatlas.nyc, ballotpedia.org, 270towin.com, ballotpedia.org, dlcc.org
Frequently asked questions
What determines if a state is red or blue?
A state is typically called red if it votes Republican in presidential elections and blue if it votes Democratic. Legislative control and governorship also play a role in how the label is applied. (NCSL definition)
How often does the red and blue state map change?
The presidential map changes every four years after an election. Legislative control maps can shift every two years during state elections. Major realignments are rare but happen. (Ballotpedia legislative cycles)
Are there any states that are both red and blue?
No state is officially both, but many have split legislative chambers (e.g., Pennsylvania, Michigan, Minnesota). County-level maps also show that a “red” state can have many blue counties and vice versa. (Ballotpedia county maps)
What is the most recent red and blue states map?
As of mid-2026, the most recent map is based on the 2024 presidential election and the 2026 legislative control data. The map is stable, with no recent changes in partisan control. (MultiState 2026 map)
Can a state switch from red to blue?
Yes, states can switch. Historically, some states like Indiana and Ohio have shifted between red and blue over decades. Virginia switched from red to blue in the 2000s. (270toWin historical data)
What is the difference between a red state and a blue state in terms of policy?
Red states tend to enact conservative policies (lower taxes, fewer regulations, restrictions on abortion), while blue states lean progressive (higher minimum wages, stronger environmental laws, broad abortion access). (NCSL policy comparisons)
How do county-level maps differ from state-level maps?
County-level maps show the actual voting patterns within each state. A state that appears solid red on a state map may have several blue urban counties. This granular view is more useful for understanding local political dynamics. (Ballotpedia county trends)
More related posts
 Wordle Words Already Used: List of All Past Answers
 When Will Verizon Be Back Up? Timeline & Reconnection Guide
 Samsung Galaxy S26 Ultra: Specs, Ireland Price & Release
 Shelley Hennig Movies and TV Shows: Full Filmography & Bio
 Capital One Credit Cards: Best 2026 Options Compared
 How to Draw a Bunny: Easy Step-by-Step Tutorial for Beginners
 USPS Pre ident Day Clo ure: What’ Open, Mail Delivery?
 How to Cook Bacon in the Oven: Time, Temp & Tips